Professional Tools for Website Analysis & Comparison
Website analysis made simple
Compare websites visually, detect changes after deployments, and check your website for broken links – all in one tool. Plus optional monitoring for availability and uptime.
Our Strengths at a Glance
Visual Comparison
Detect changes on your websites instantly – with pixel-accurate image comparison, interactive slider, and optional AI description of the differences. Ideal for deployments and migrations.
Easy Setup
Get started immediately – no programming knowledge required. Enter a URL, choose your tool, and receive results within minutes.
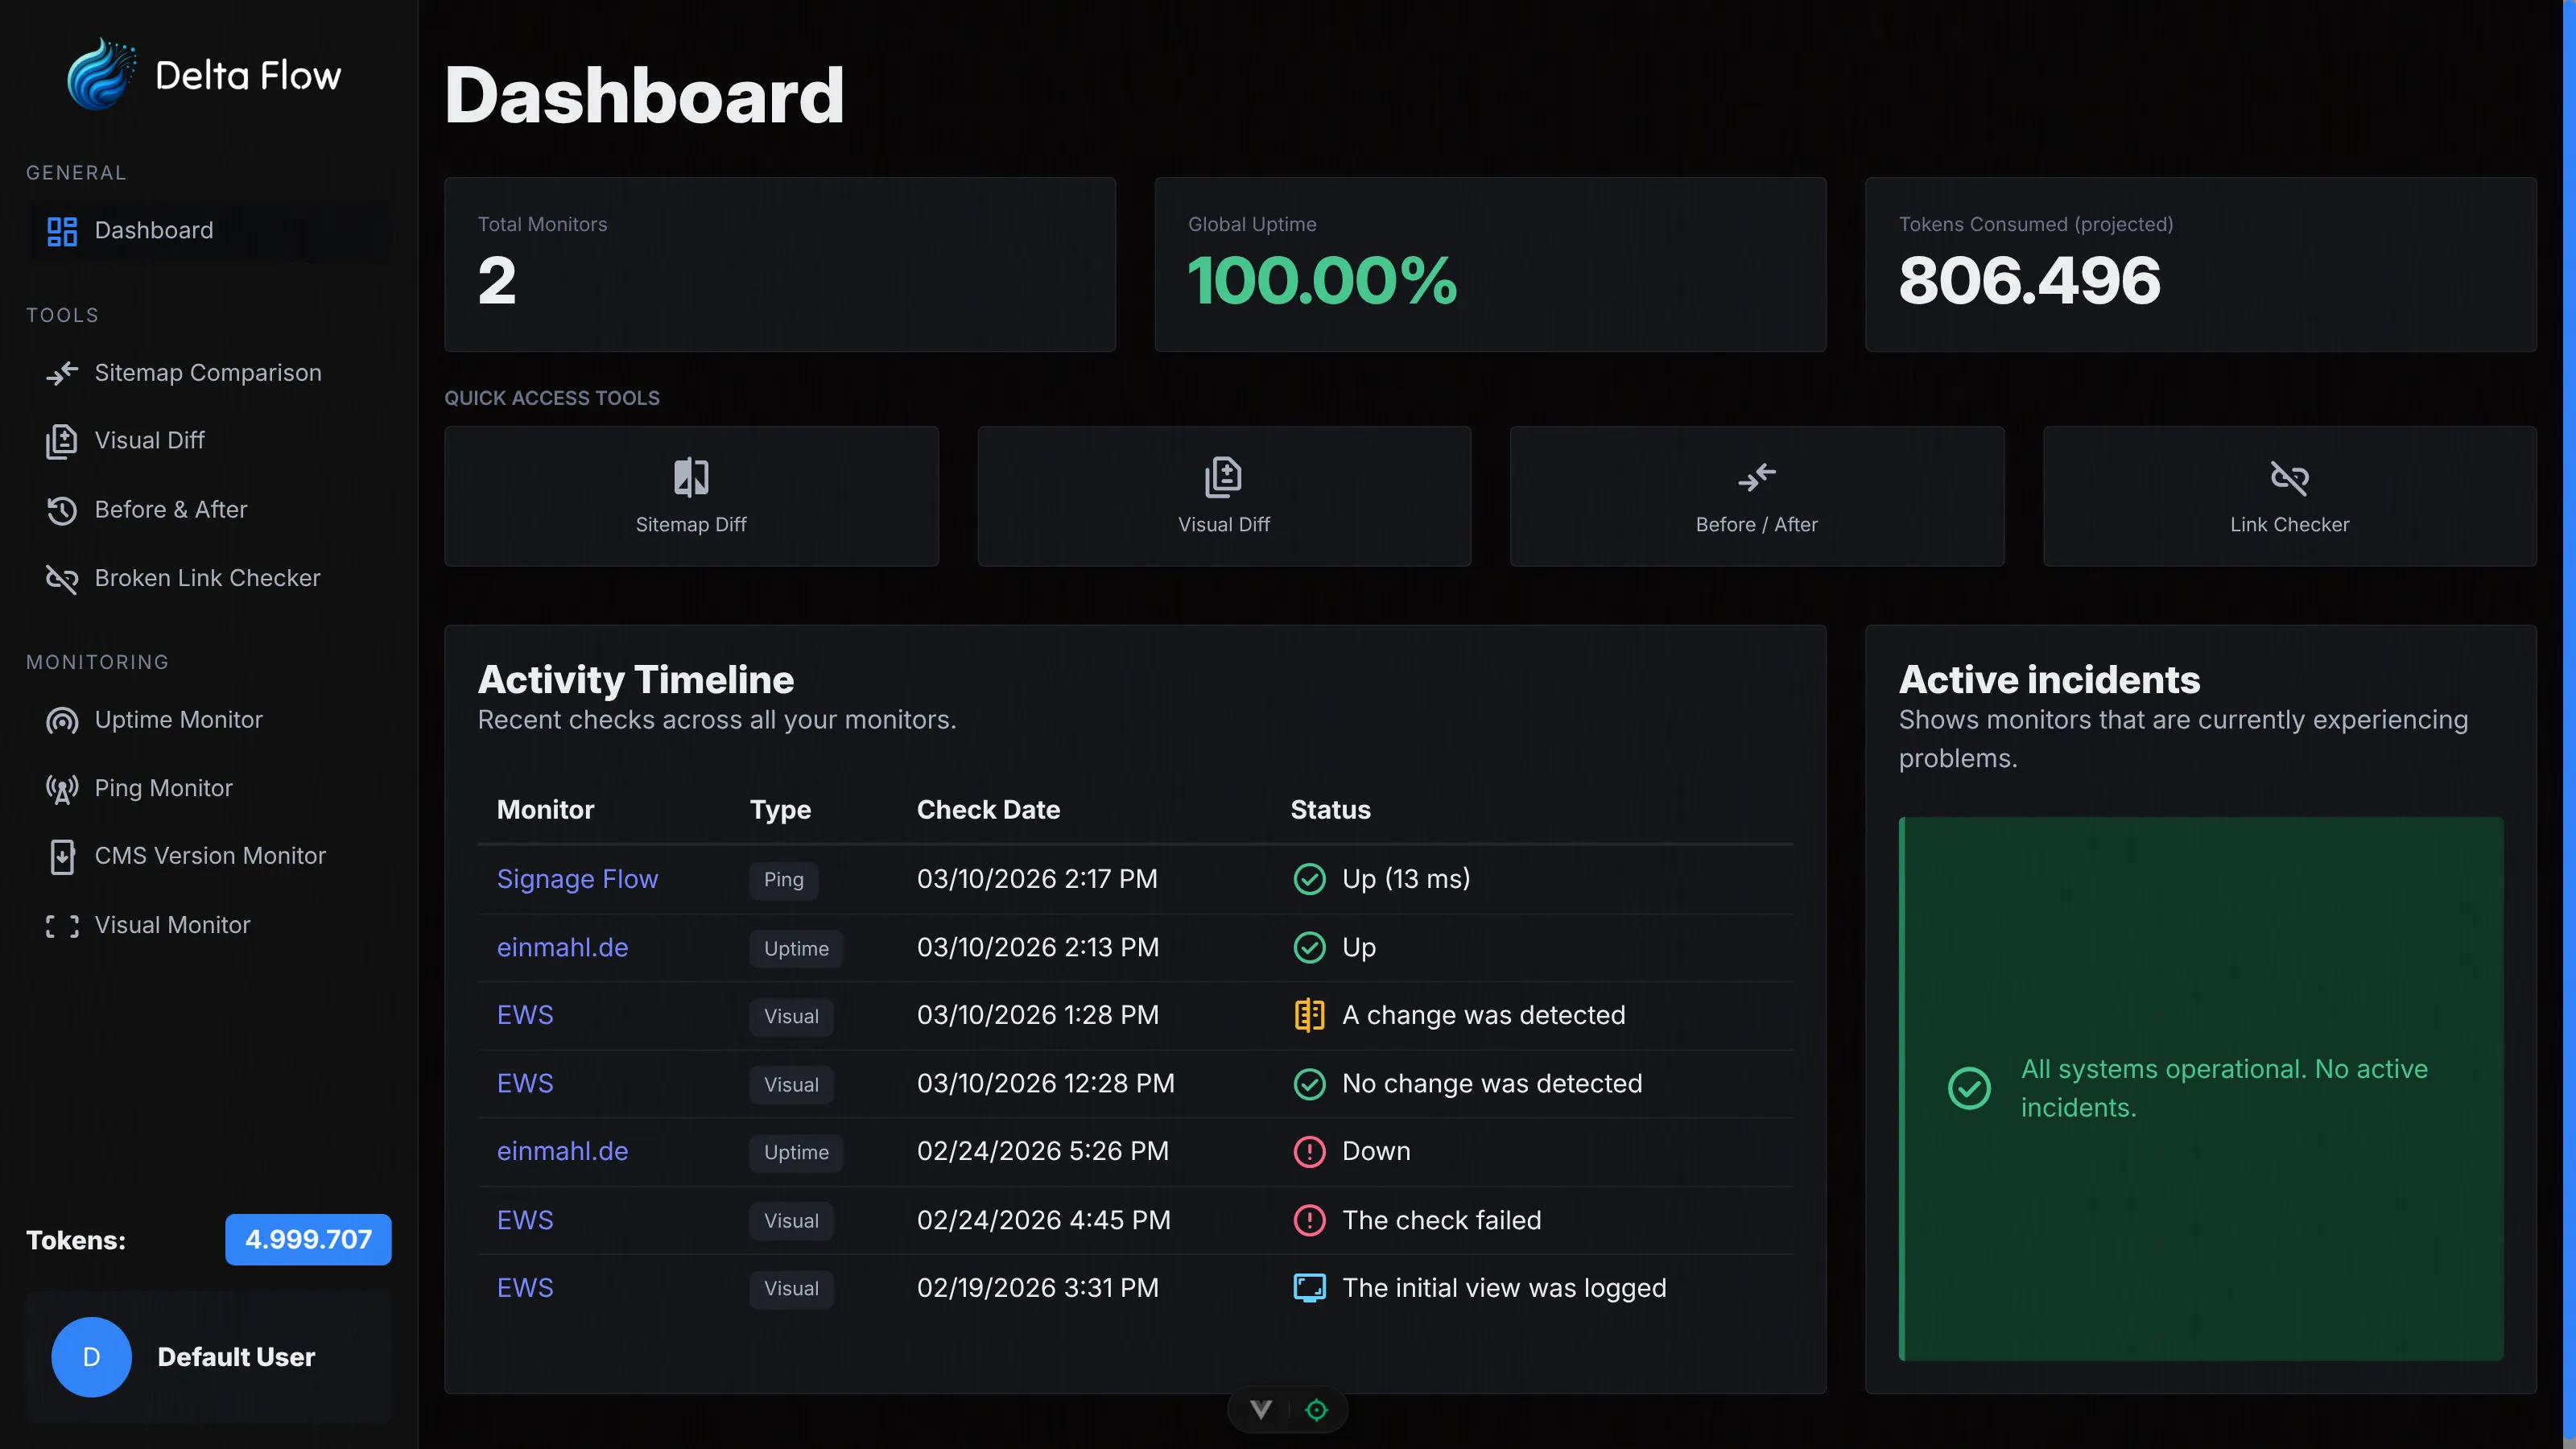
Everything in One Dashboard
Tools, monitors, and analyses in one place. Keep an overview of all your websites with clear statistics and logs.
Professional Tools for Website Analysis
Our specialized tools help you compare websites, document changes, and find issues – without any setup effort, ready to use immediately.
Visual Comparison
Compare any two URLs directly – without a sitemap. Ideal for quick one-time comparisons of two pages or environments. With interactive image slider and optional AI description of the differences.
Before / After Comparison
Create a before-snapshot of a website and compare it after deployments or migrations with the current state. Supports automatic sitemap mode and manual URL input with PDF report.
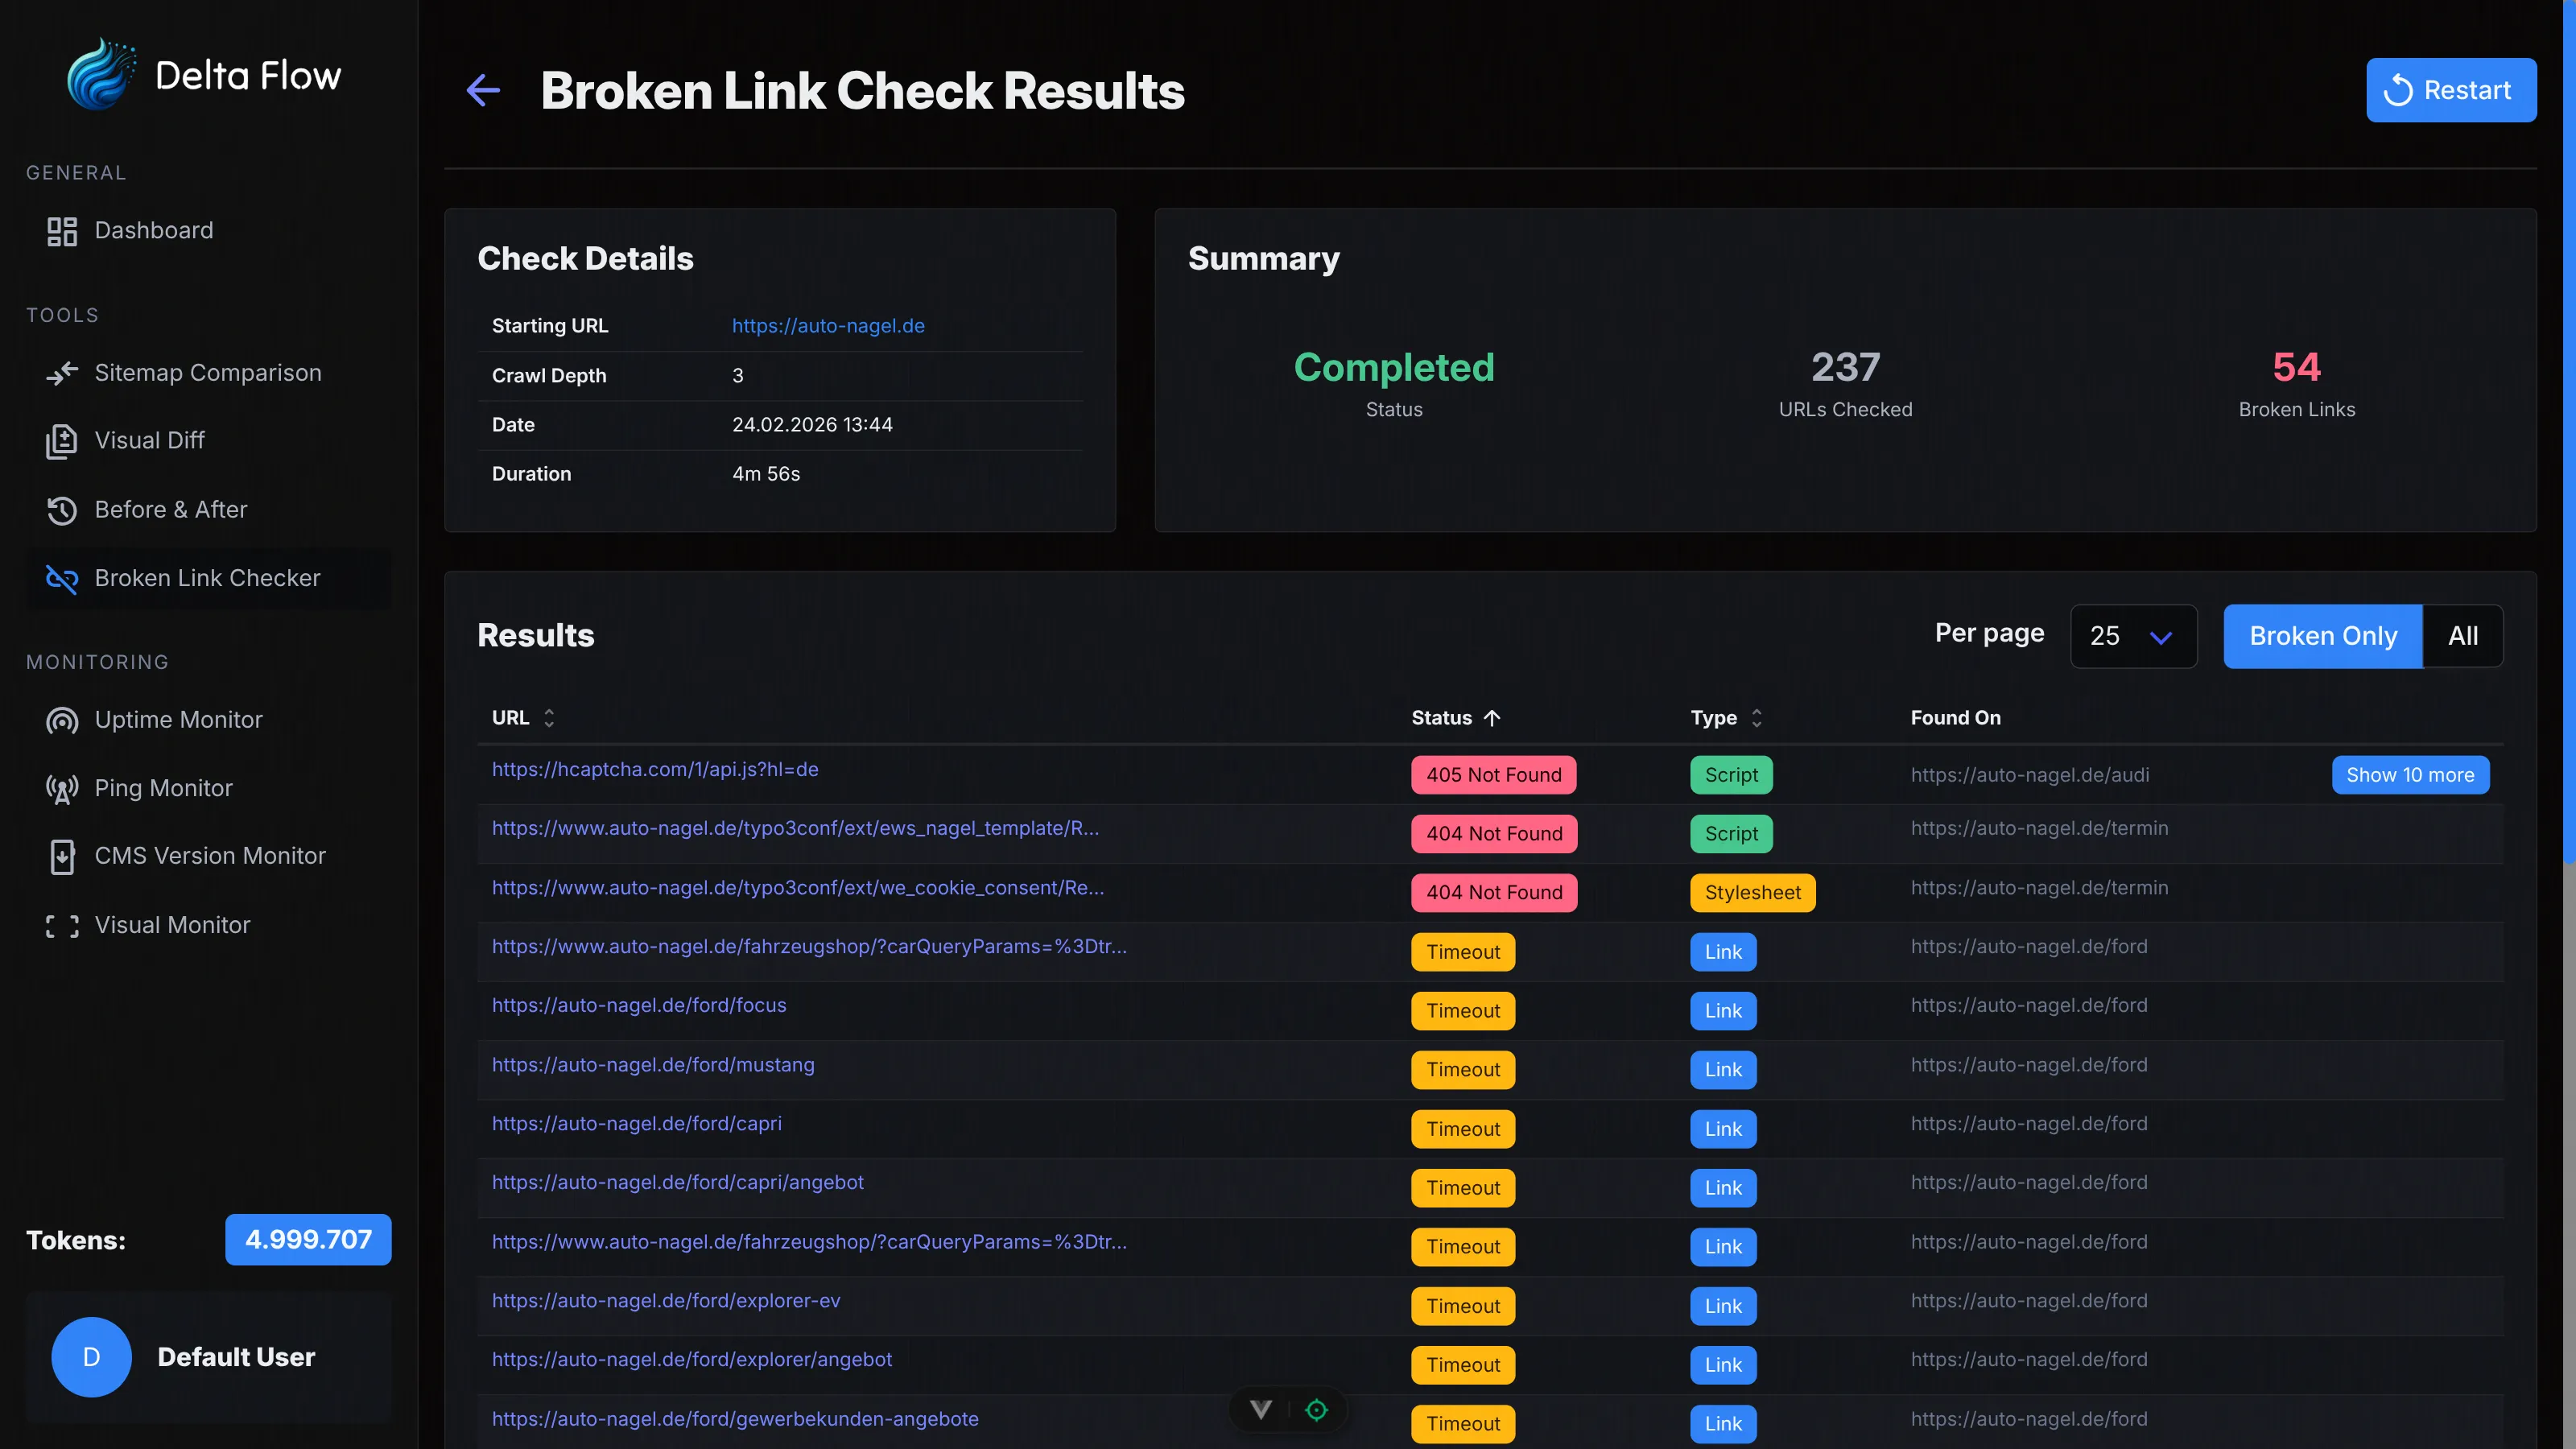
Website Health Checker
Crawl your website automatically and find all broken links. Configurable crawl depth, exclusion patterns, and delay between requests – with real-time results during crawling.
How It Works
Enter URL & Choose Tool
Choose the right tool, enter your URL, and optionally configure crawl depth or comparison options. The analysis starts with just a few clicks.
Automatic Analysis
Our systems automatically perform screenshots, crawls, and comparisons. You receive detailed visual reports and statistics for every analysis.
Results & Reports
View changes, broken links, and differences at a glance. All results are available in the dashboard and can be exported as PDF.
Monitoring Features
In addition to our analysis tools, we offer continuous monitoring for availability, uptime, and change detection.
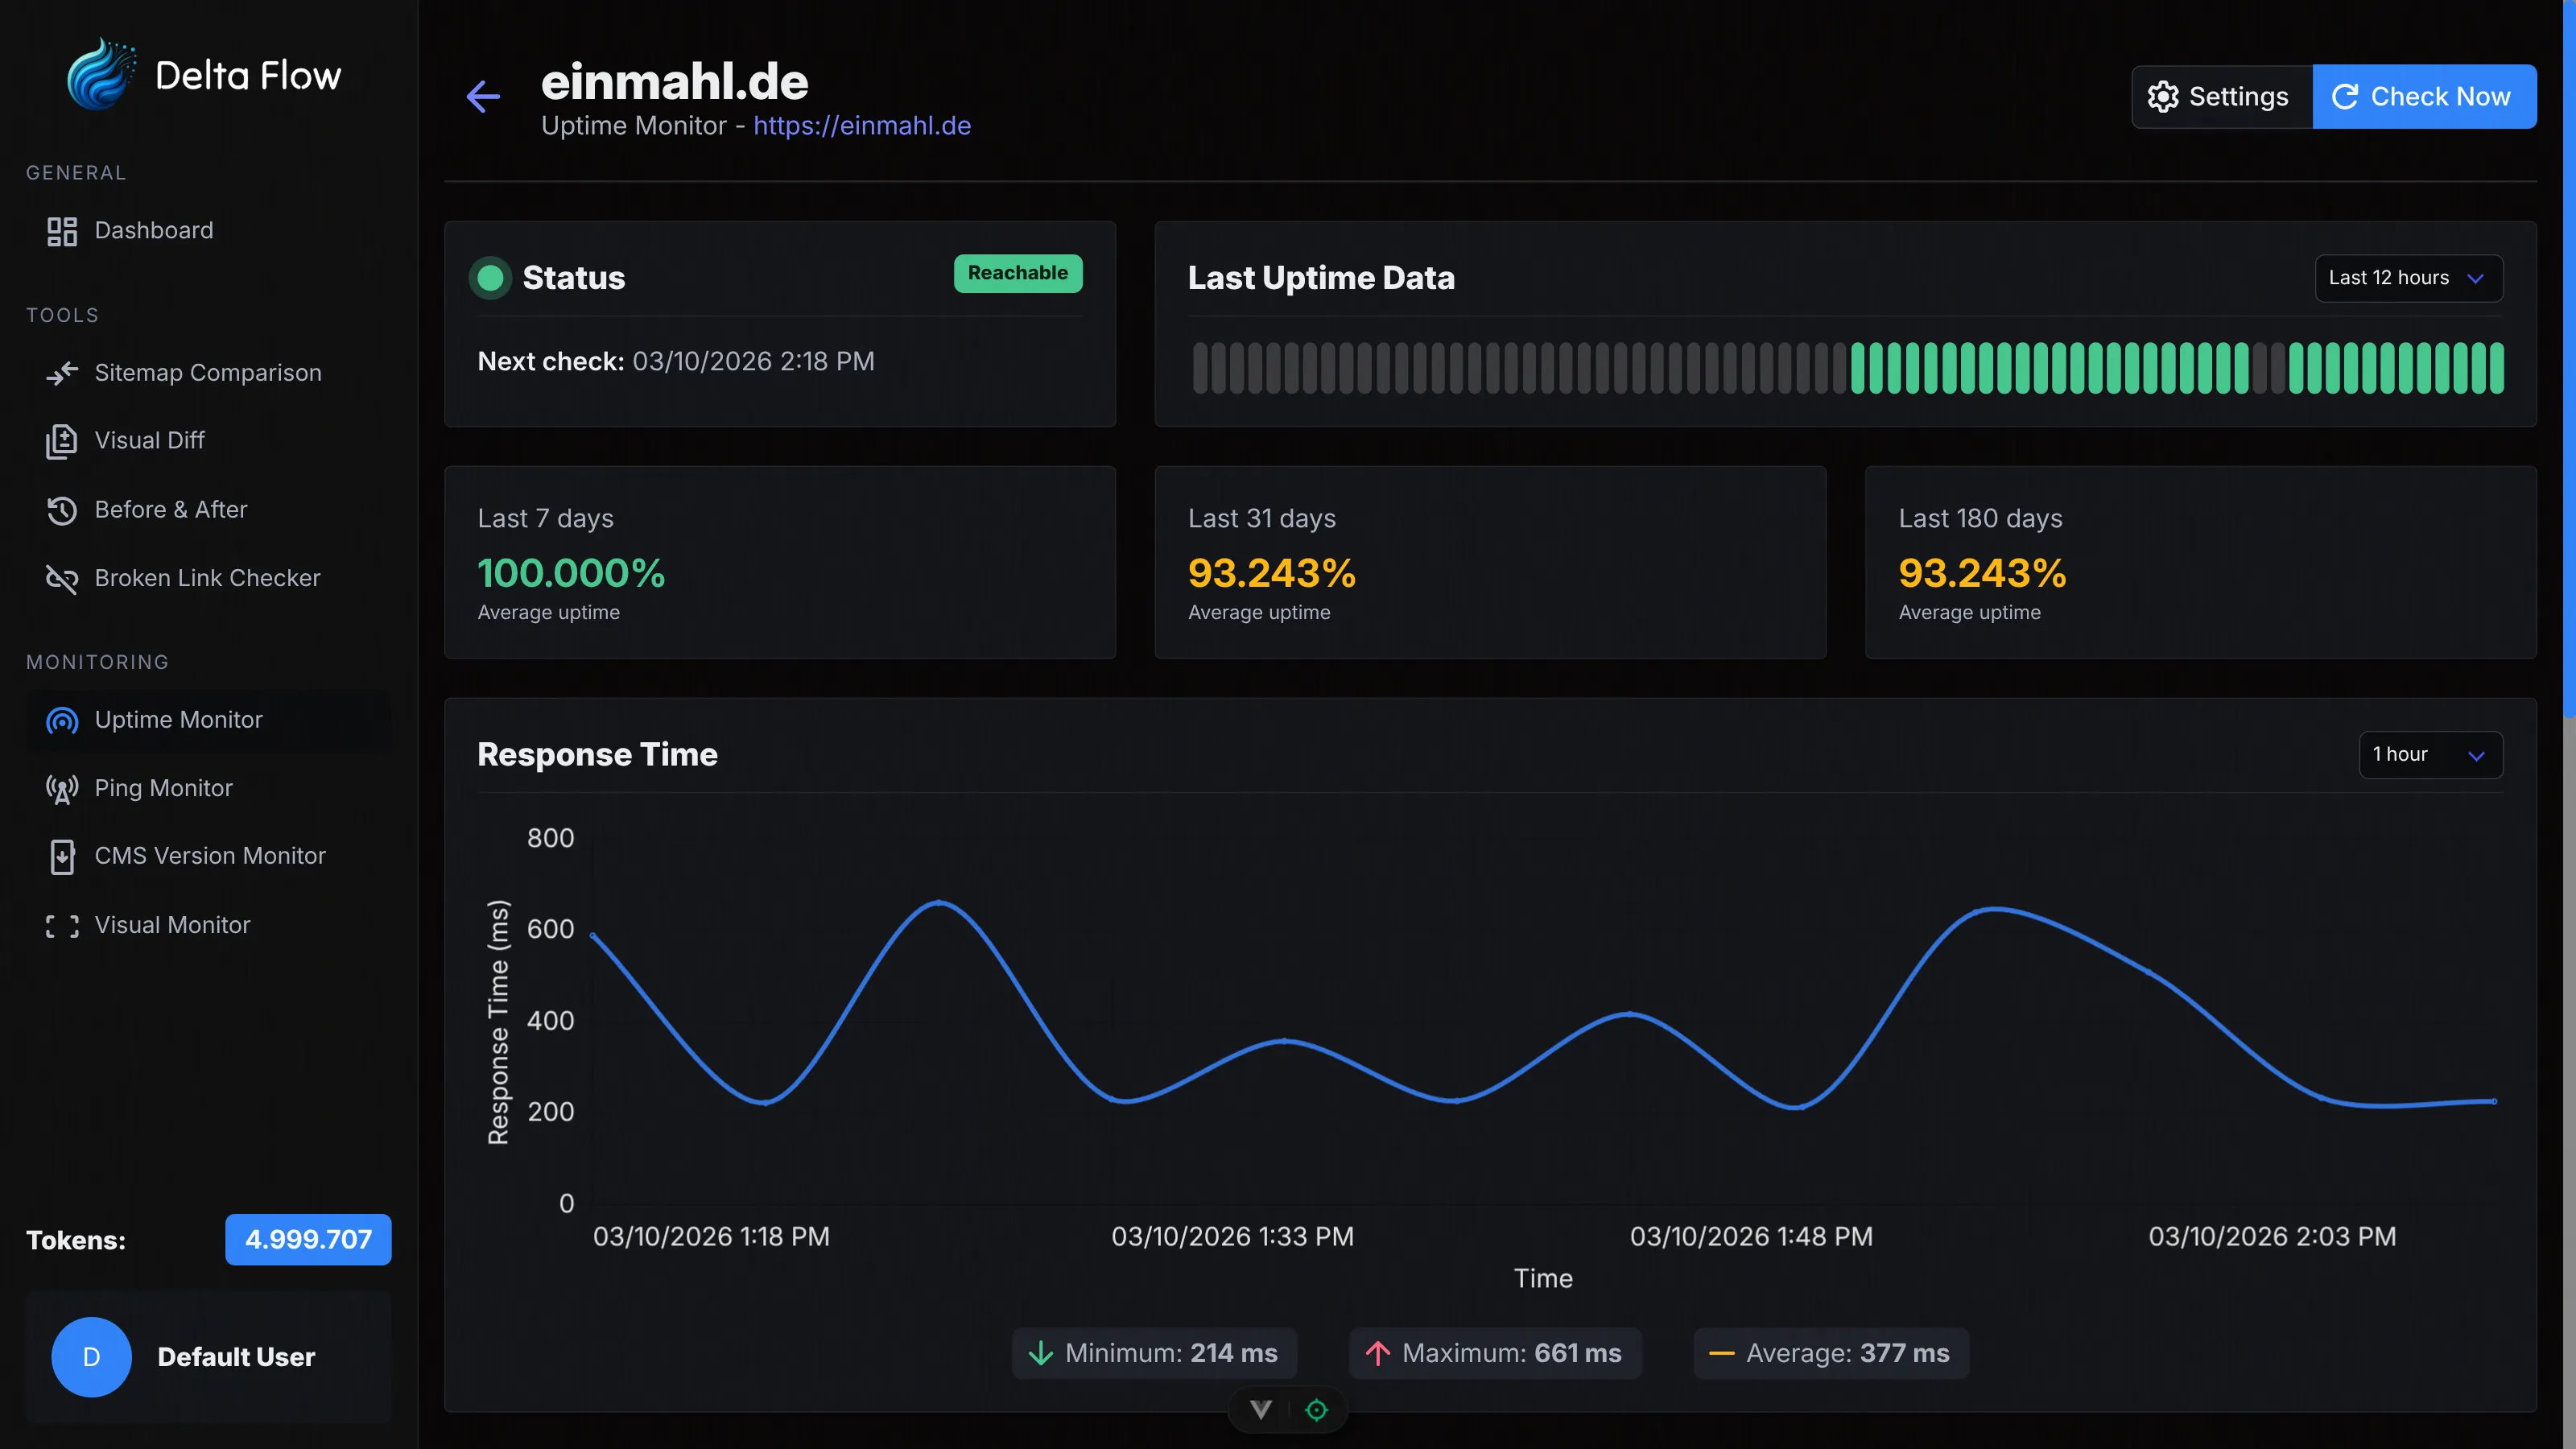
Uptime Monitor
Monitor the availability of your websites continuously. Get detailed statistics on response time, incident tracking, and historical availability data for informed decisions.
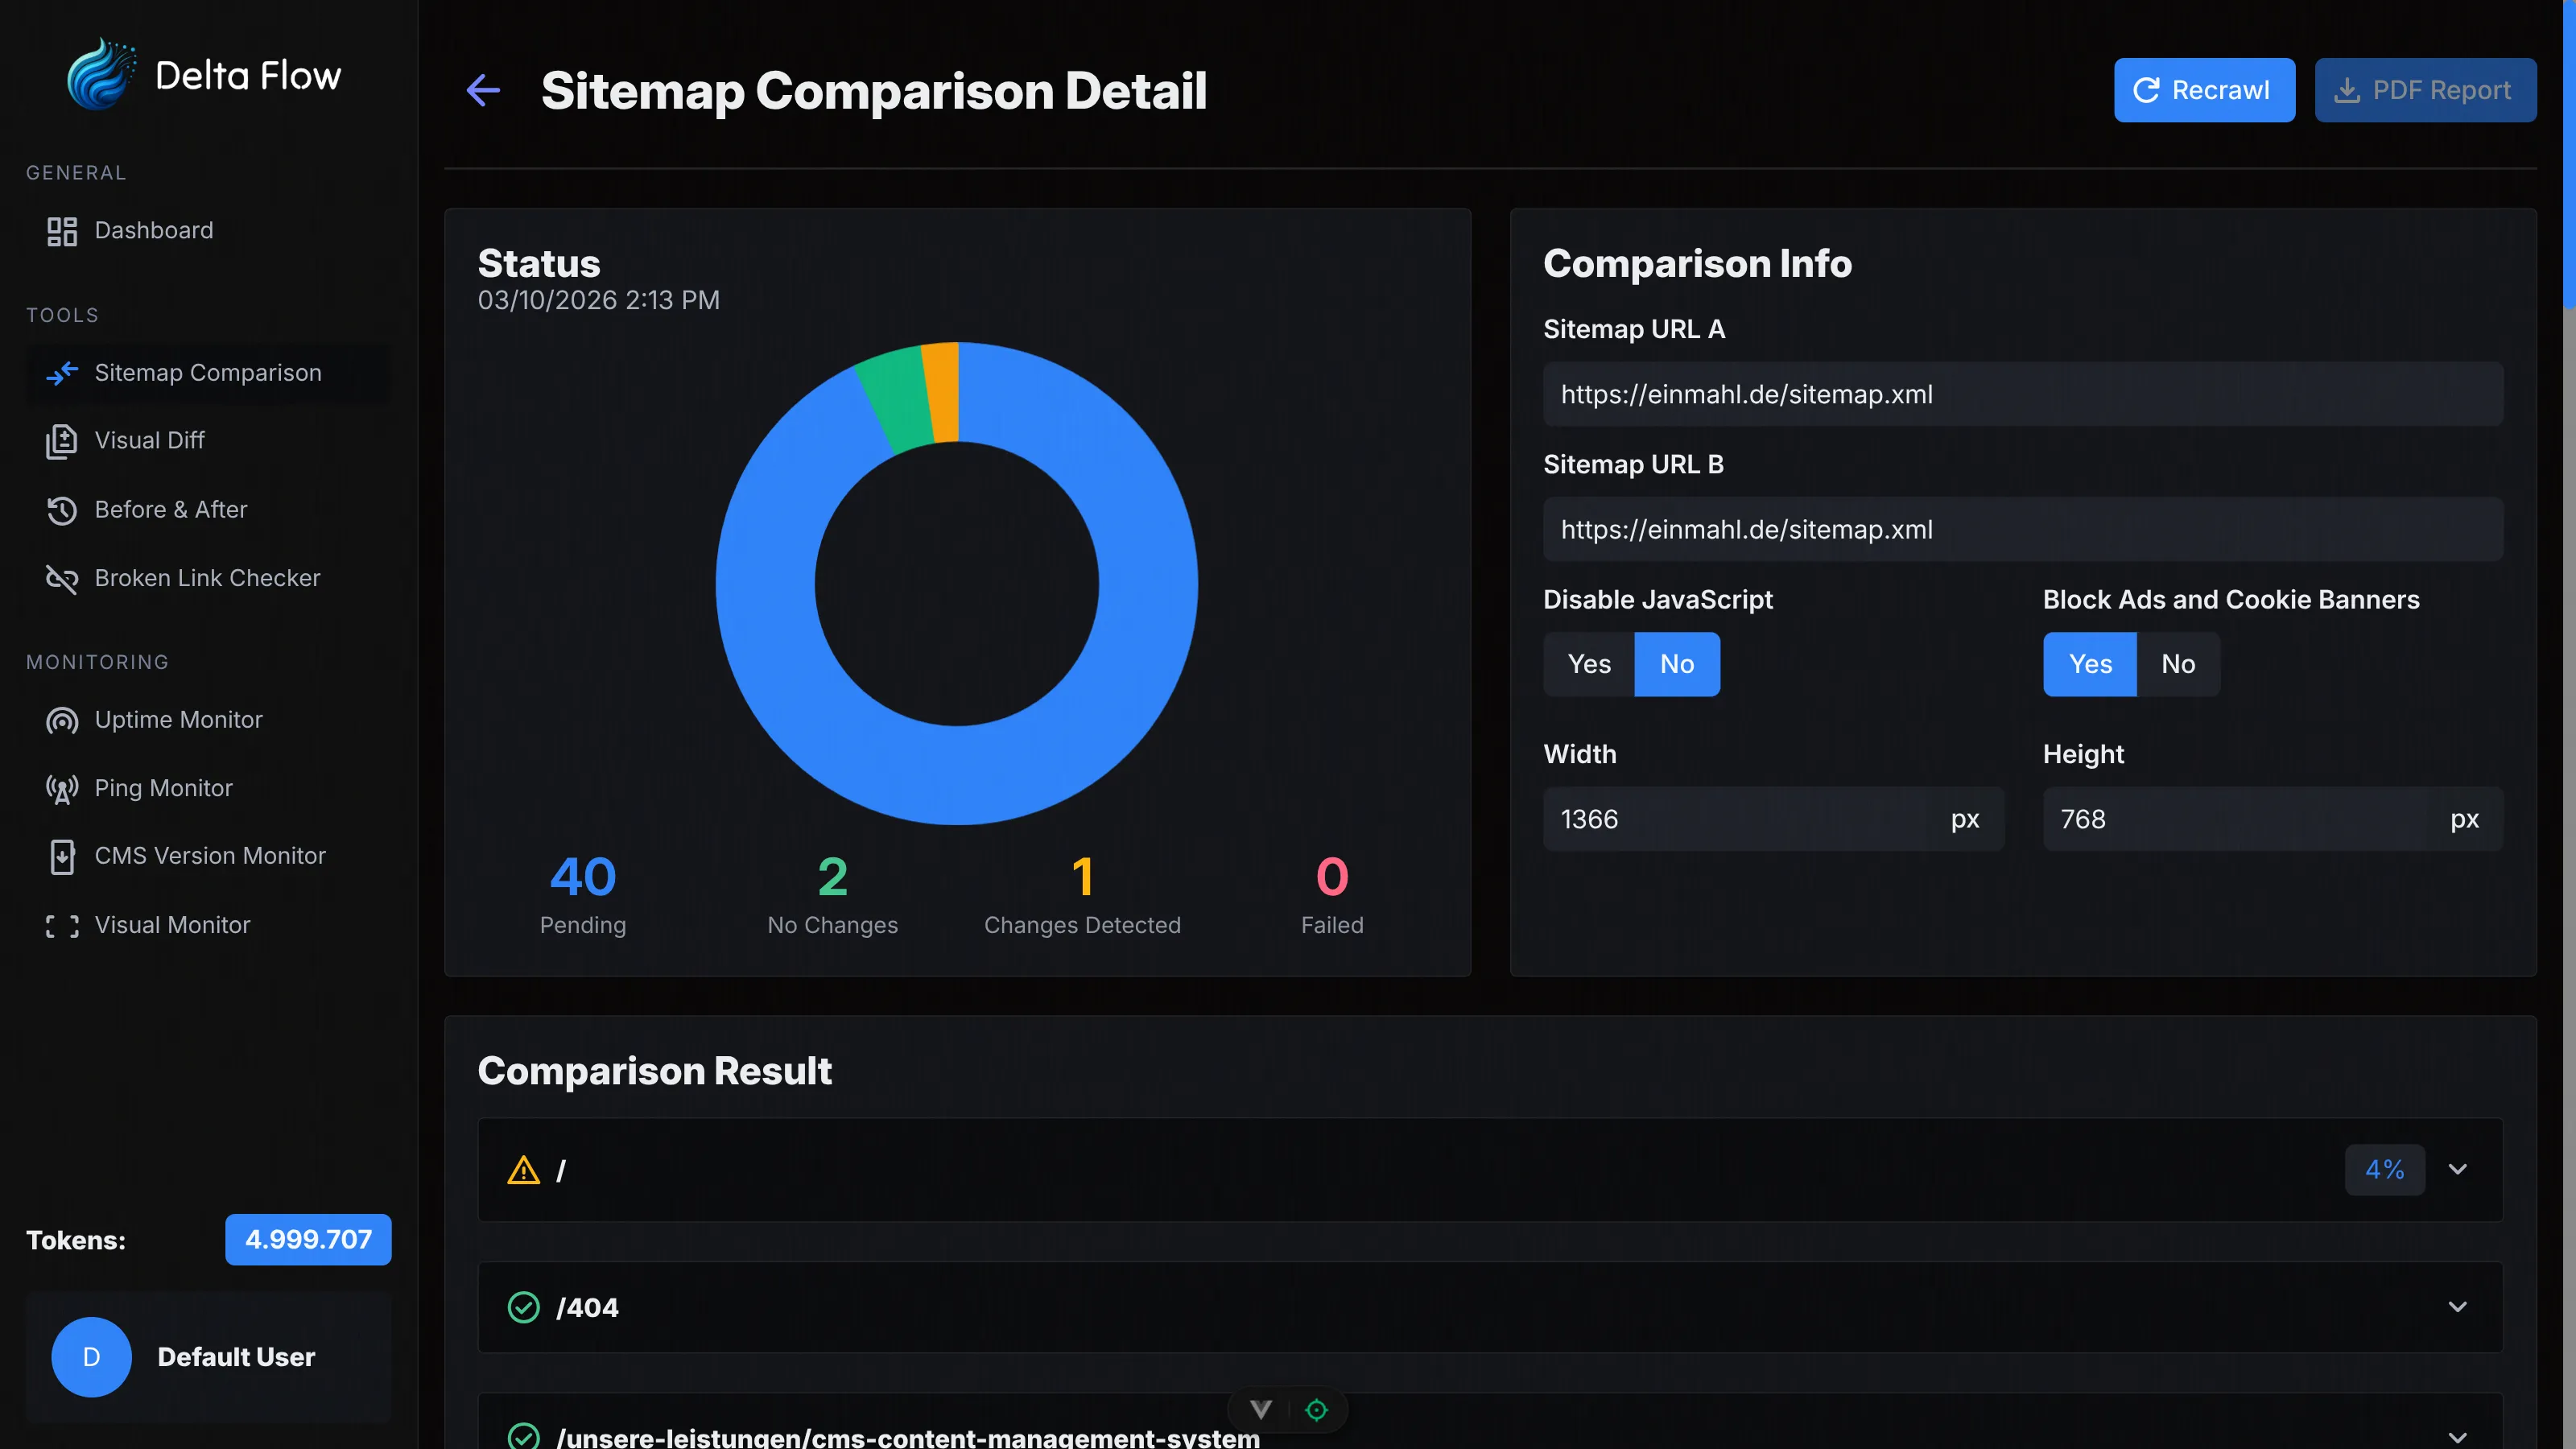
Sitemap Comparison
Automatically compare two websites page by page. Identify differences in structure and content with visual screenshots and detailed PDF reports for comprehensive analyses.
Visual Monitor
Detect changes on your website with pixel-accurate precision. Monitor full pages, individual elements, or defined regions with automatic screenshots and intelligent image comparison.
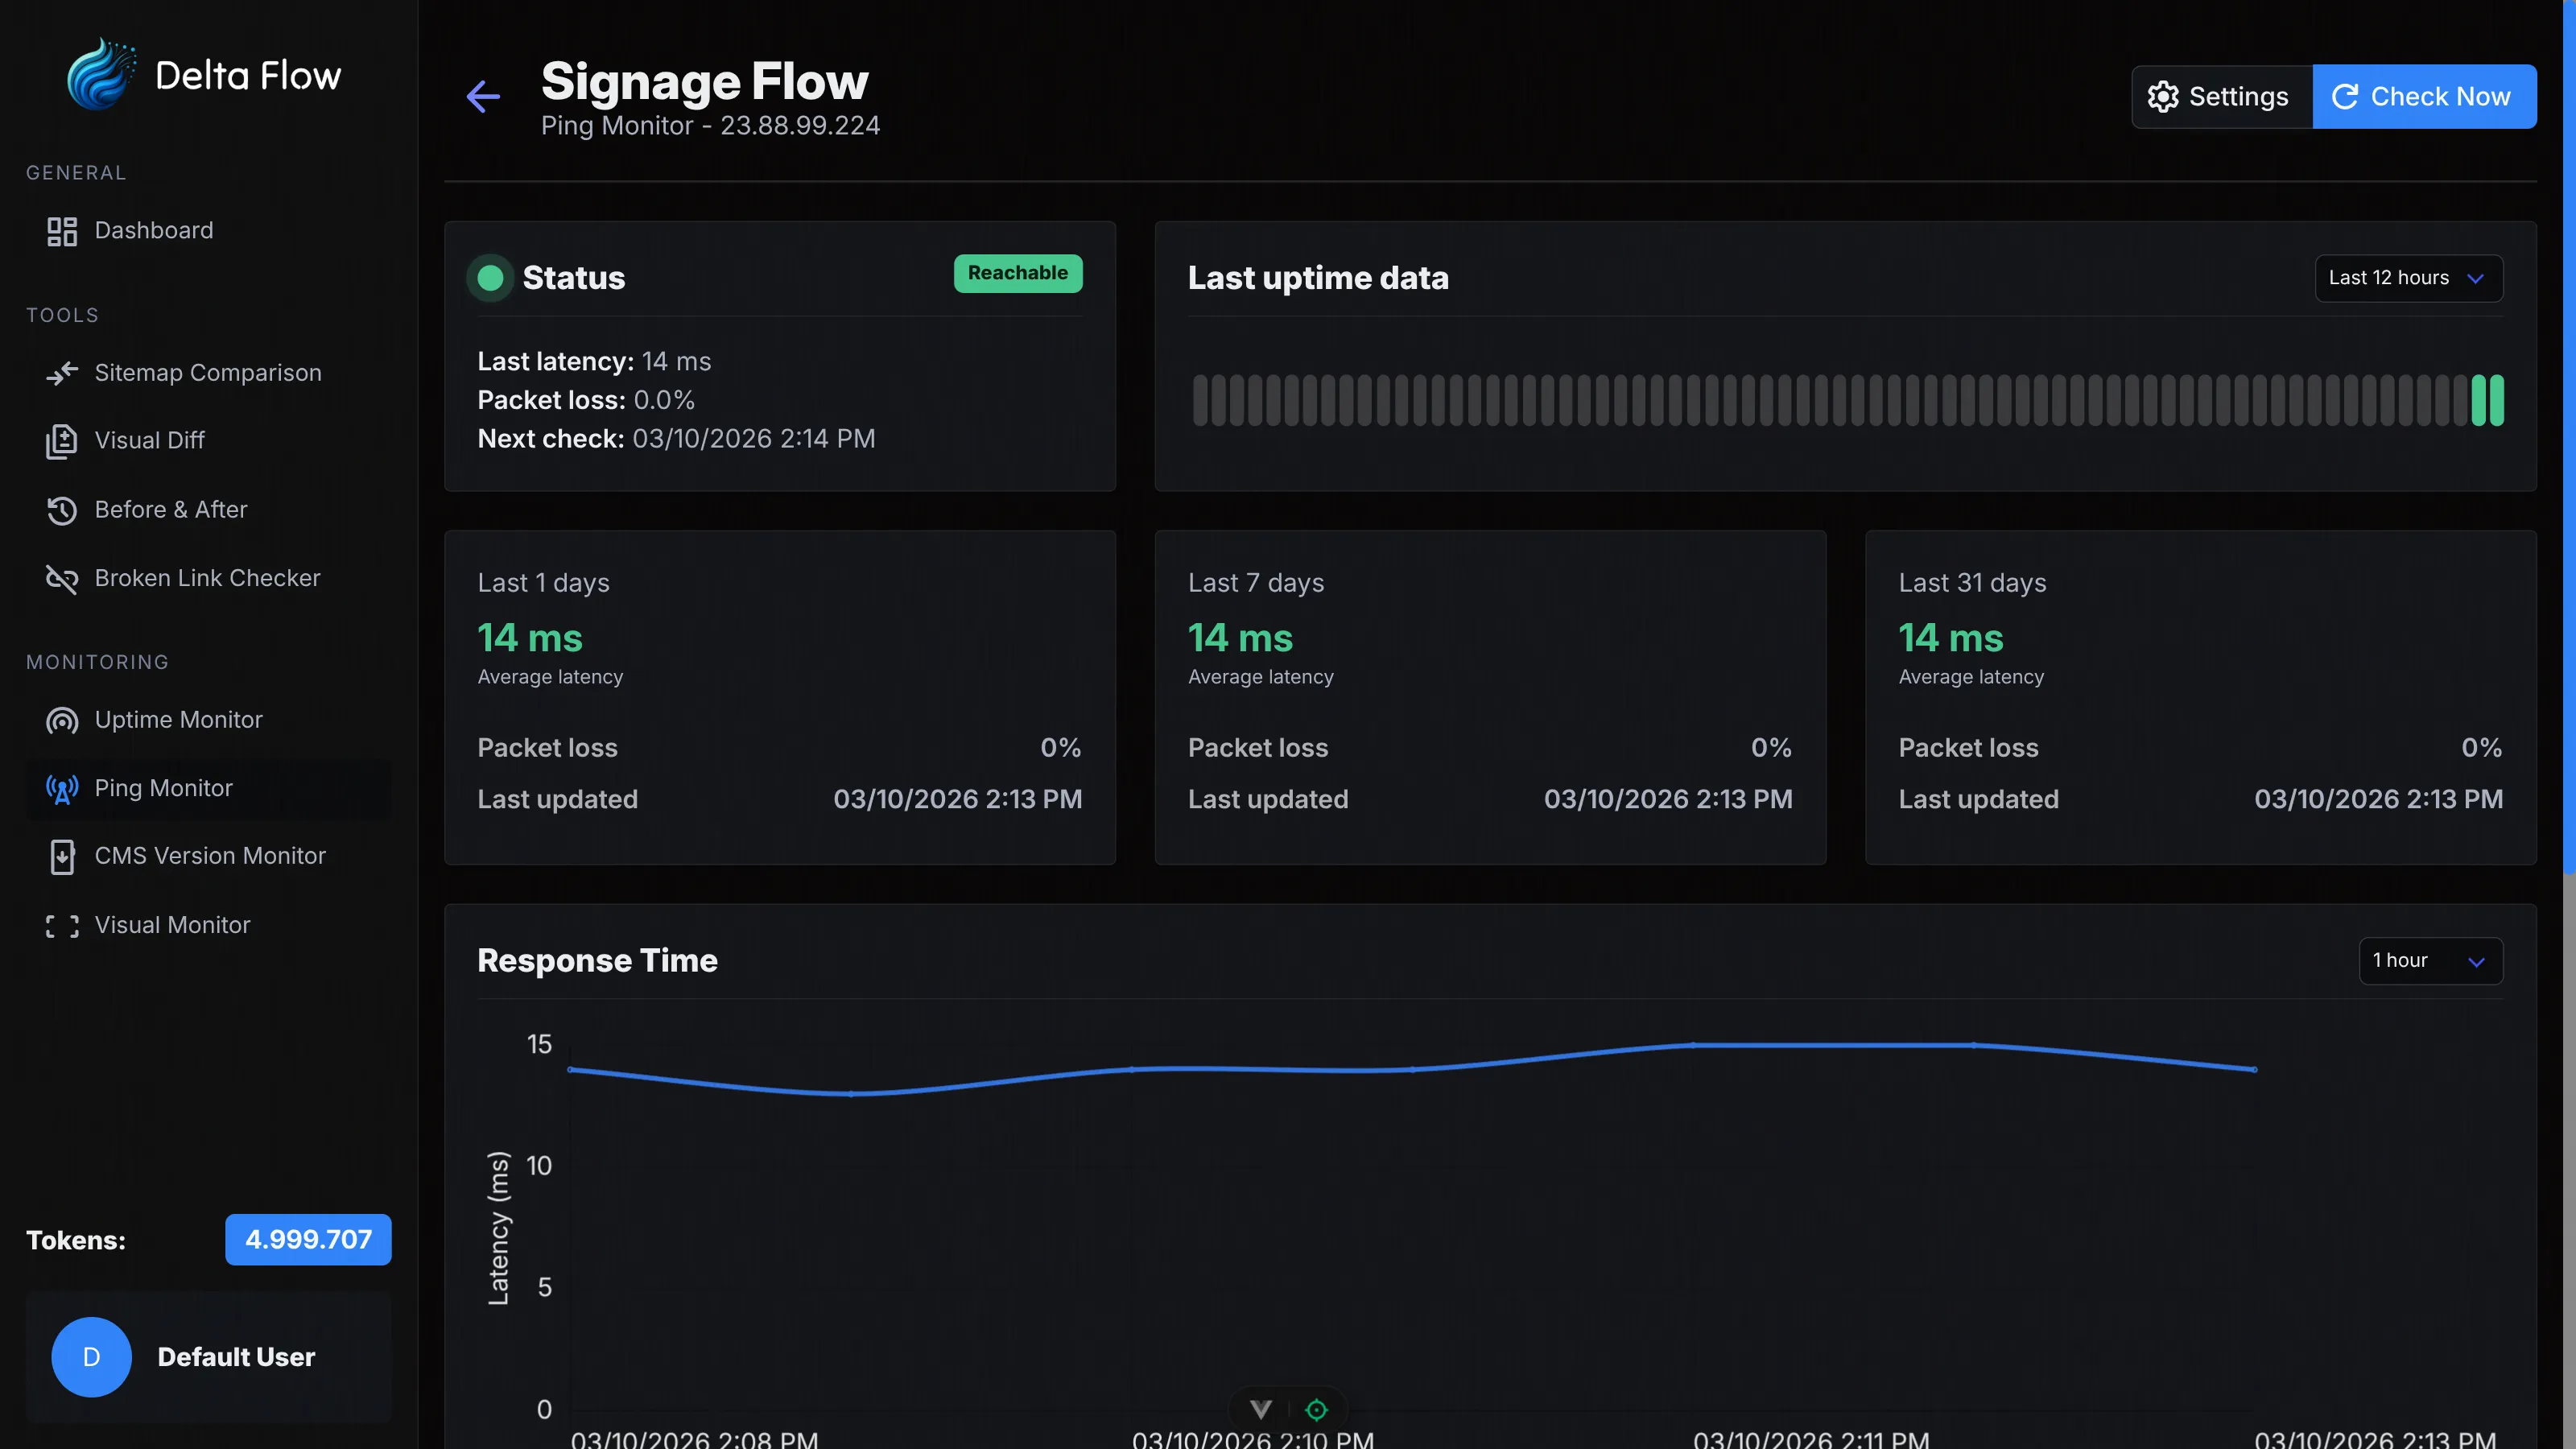
Ping Monitor
Monitor the network availability of your servers and hosts. Measure latency, packet loss, and reachability with ICMP ping checks for reliable network monitoring.
Stay always informed with configurable email notifications. Receive instant alerts for changes, outages, or important events – including to custom email addresses.
Flexible Token System
Pay only for what you use. Our transparent token system enables flexible use of all monitoring features with monthly allocation and clear cost control.
Fair Pricing
Our flexible token system allows you to pay only for what you actually use. Each monitor check consumes tokens based on the type and configuration. Every month you receive a fixed number of tokens that you can distribute freely across all monitoring features.
Examples of token consumption:
- Uptime Monitor: Very efficient – 500 checks consume 1 token. With checks every 15 minutes, that's about 6 tokens per month. This lets you run many uptime monitors simultaneously.
- Ping Monitor: Even more efficient – 1,000 checks consume 1 token. With checks every 15 minutes, that's about 3 tokens per month. Ideal for monitoring many servers simultaneously.
- Visual Monitor: Each screenshot check consumes 1 token. With hourly checks, that's 24 tokens per day or about 720 tokens per month. Optionally you can enable AI descriptions for detected changes, which cost an additional 2 tokens per change.
- Sitemap Comparison: 1 token is consumed per compared page. Comparing 50 pages costs 50 tokens. With AI descriptions enabled, an additional 2 tokens are added per detected change.
FAQ